Overview
What it does
Deep packet inspection tells you what a client is doing. Enforcement is what you do about it. DHCP Shield Pro separates the two: inspection runs in userspace, where it has the freedom to parse and reason about every packet, while enforcement is applied inline in the Linux kernel through NFQUEUE — the kernel mechanism that hands a packet to userspace for a verdict and takes the answer back. The outcome is applied before the DHCP packet reaches your server, at kernel speed.
This page covers both halves: the enforcement mechanism itself, and the controls an administrator uses to drive it — manual actions, scheduled automation rules, bulk operations, direct firewall management, and the notifications that carry events out to the systems you already run.
Native enforcement
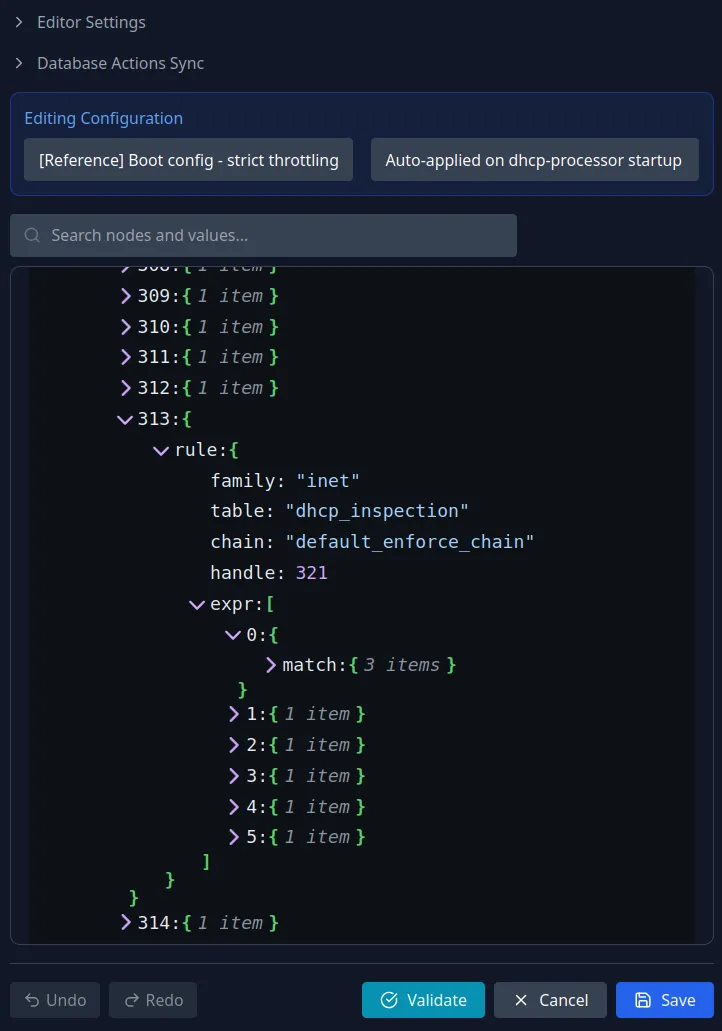
Native nftables, edited in the GUI
Every enforcement profile is ordinary Linux nftables configuration — the same kernel firewall the community has hardened for years. DHCP Shield Pro does the classification in userspace and leaves enforcement to nftables. There is no parallel enforcement engine to trust: the part that has to be fast and reliable is the part the kernel already does well.
And you never have to touch the command line to manage it. The appliance reads and writes the live nftables state directly, so you edit firewall profiles in the GUI — validate a change against the kernel's own parser, then apply it on your terms.
Mechanism
Kernel-level enforcement
Enforcement works in two lines of defence.
The first line is the firewall itself. It tracks every client individually, counting that device's DHCP messages over a short rolling window. A client that crosses its limit is throttled or dropped immediately — per device, in the kernel, with no analysis step and no round trip. For the everyday case of a single device misbehaving, this first line is frequently enough on its own.
The second line watches longer-term behaviour. Above the firewall, the Automation module looks at how each device behaves over wider windows — minutes, hours, or days. That earns you the visibility to understand what a client is really doing, and the means to act on it: a scheduled rule can throttle or block the device, raise an alarm, or hand it to an LLM for a closer look using a prompt you control.
Both lines speak the same vocabulary — six actions: block, deny, throttle, monitor, allow, and cleanup. Block drops a device's DHCP packets while still recording its events. Deny is the strongest action — a permanent drop that also suppresses event emission. Throttle rate-limits a noisy-but-valid client instead of removing it. Monitor tags a device for extra logging without touching its traffic. Allow trusts a client and bypasses enforcement. Cleanup lifts any of the above in a single step. Each action carries a default duration and expires on its own once the timeout elapses.
| Action | Default duration | Effect on traffic |
|---|---|---|
| Block | 2 hours | Drops the client's DHCP packets in the kernel; events are still recorded. |
| Deny | Permanent | Permanent drop, and suppresses event emission — for confirmed-bad clients. |
| Throttle | 1 day | Rate-limits a noisy-but-valid client instead of removing it. |
| Monitor | 7 days | Extra logging only — the device's traffic is untouched. |
| Allow | 30 days | Trusts a client and bypasses enforcement for it. |
| Cleanup | — | Removes the device from every set in one step. |
Resilience
Fail-open by design
The kernel hands each DHCP packet to the inspection engine through NFQUEUE, and that handoff carries a bypass flag. If the engine can't take the packet, the kernel doesn't hold it or drop it — it lets it through.
If inspection ever stops, traffic passes straight through — your DHCP service never depends on us staying up.
That bypass covers every way inspection can go away. Stop the userspace service for an upgrade, have it crash, or catch it mid-restart, and DHCP keeps flowing. The same holds under load: if the inspection queue ever fills faster than it drains, packets are passed rather than queued or dropped. Inspection is the part that can pause; your DHCP service is the part that must not — so whenever the two are in tension, availability wins.
The bypass behaviour is verifiable on your own appliance — a self-test confirms the kernel can pass DHCP through to acceptance when the inspection service is absent.
| If this fails… | …this is the effect |
|---|---|
| Inspection service stops or crashes | The kernel bypasses the queue and forwards DHCP packets unimpeded. No inspection, no enforcement, no impact on DHCP delivery. |
| Enforcement rules are flushed | No packets are handed to the inspection path; DHCP flows unrestricted (fail-open). The service sits idle until rules are restored. |
| Analytics database is unreachable | Live filtering and enforcement continue against the rules already loaded in the kernel. New events are not stored until the database returns. |
| Admin GUI / API proxy crashes | The GUI and API are unavailable, but packet processing, event storage, anomaly analysis, and automation all continue unaffected. |
| Optional analysis backend unreachable | The analysis cycle logs the error and retries; existing enforcement persists and the built-in heuristic detectors keep running. |
| Support backchannel down | No operational impact — the appliance keeps inspecting and enforcing. |
| License expires | Enforcement actions become read-only and licensed features lock; rules already active in the kernel keep running until manually cleared. DHCP delivery is never affected. |
Manual control
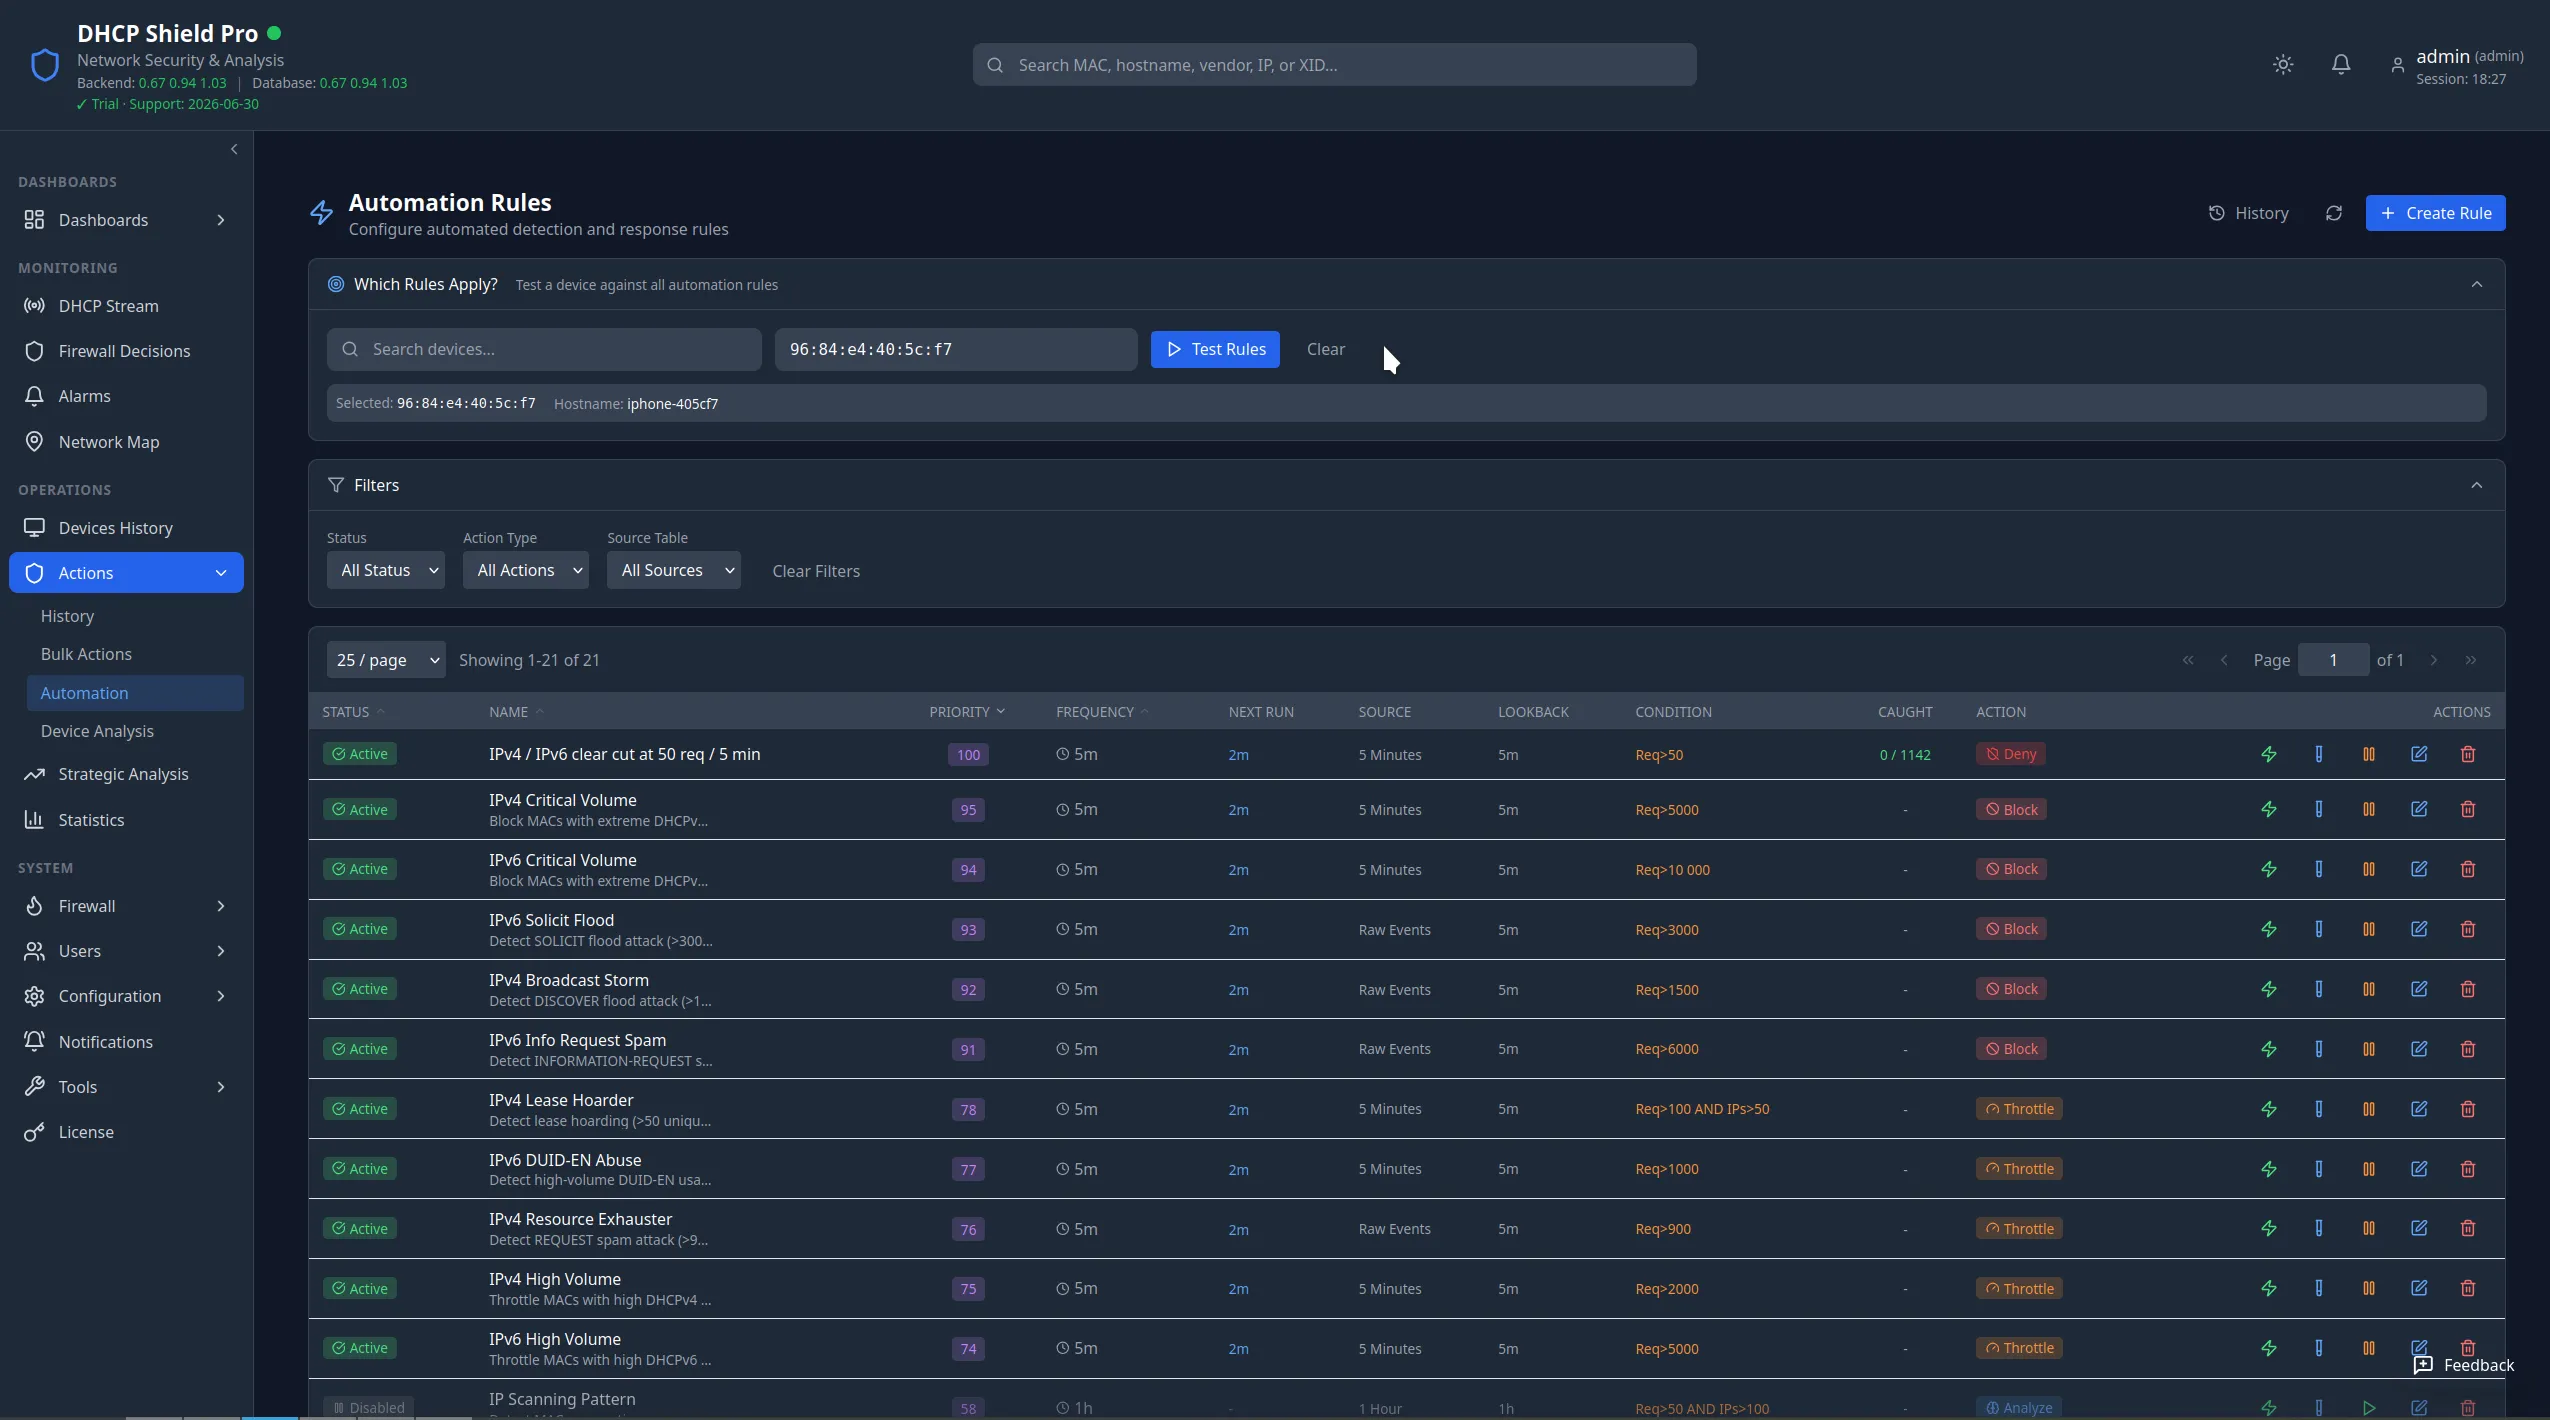
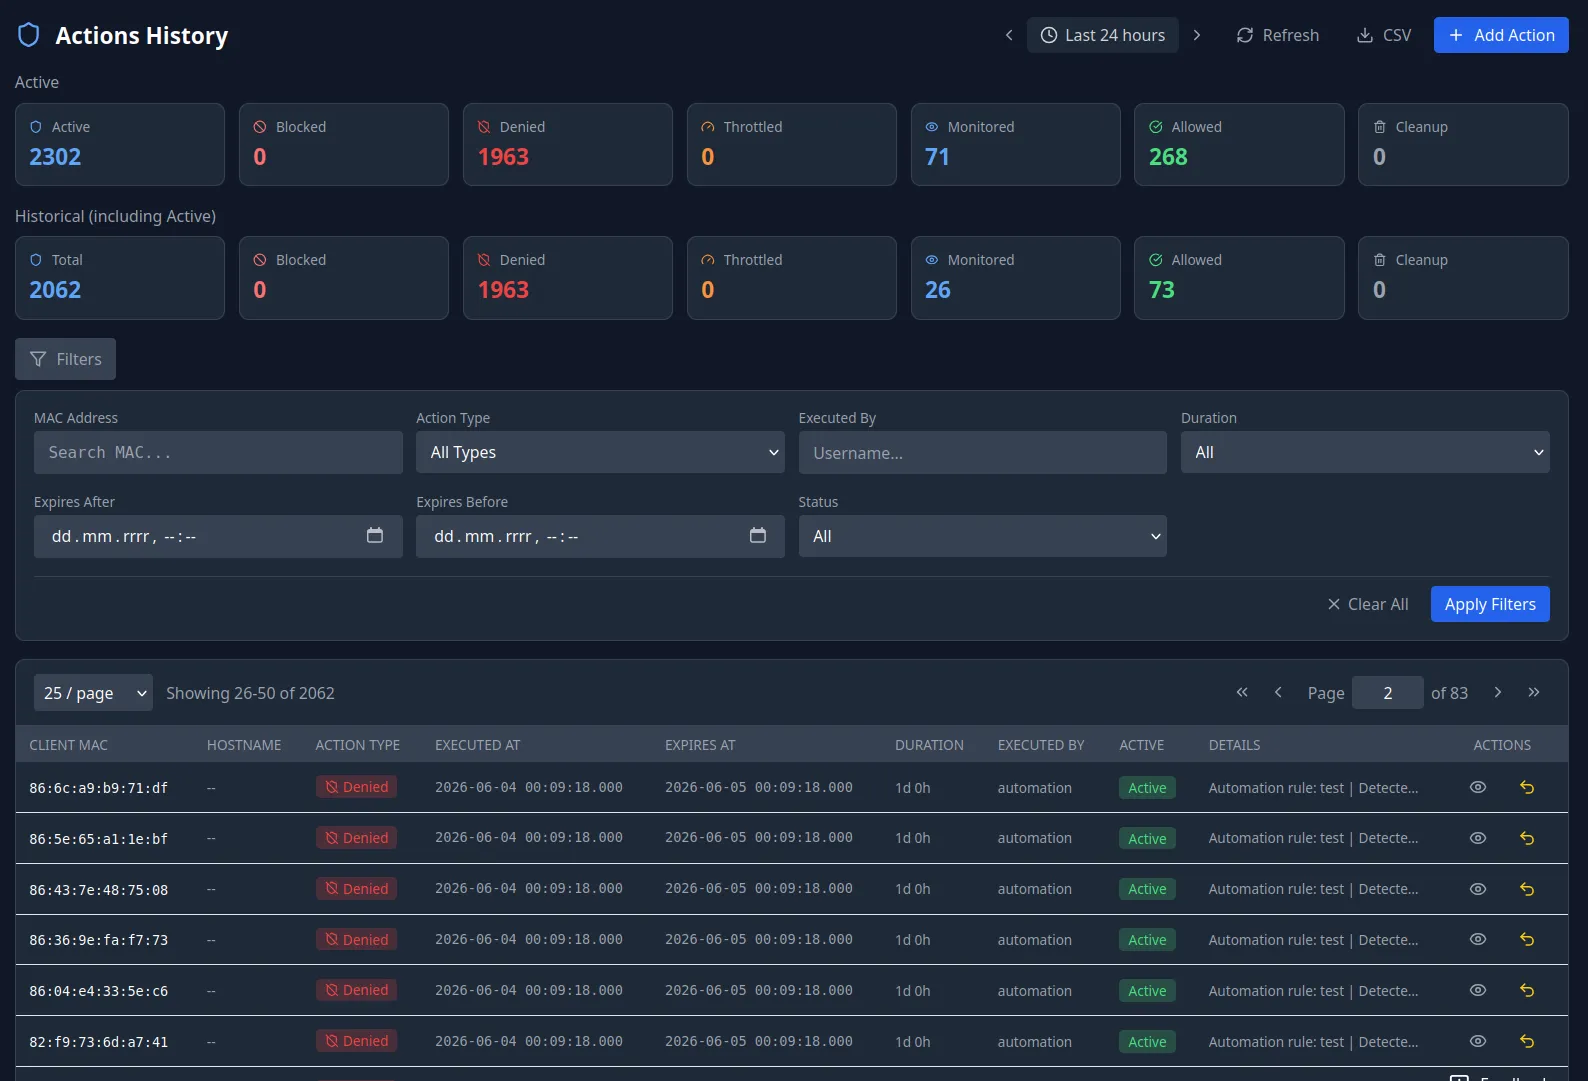
Actions
The Actions area is where you see what enforcement is applied to which device and take new action by hand. Apply any of the six actions to a single client by entering its MAC, with a preset or custom duration and an optional reason that follows the action into the audit history. A time-ranged, filterable log records every action ever taken — manual, automation, or LLM — so you always have an authoritative answer to "who blocked this device, and when?". Active actions can be undone in one click.
Hands-off control
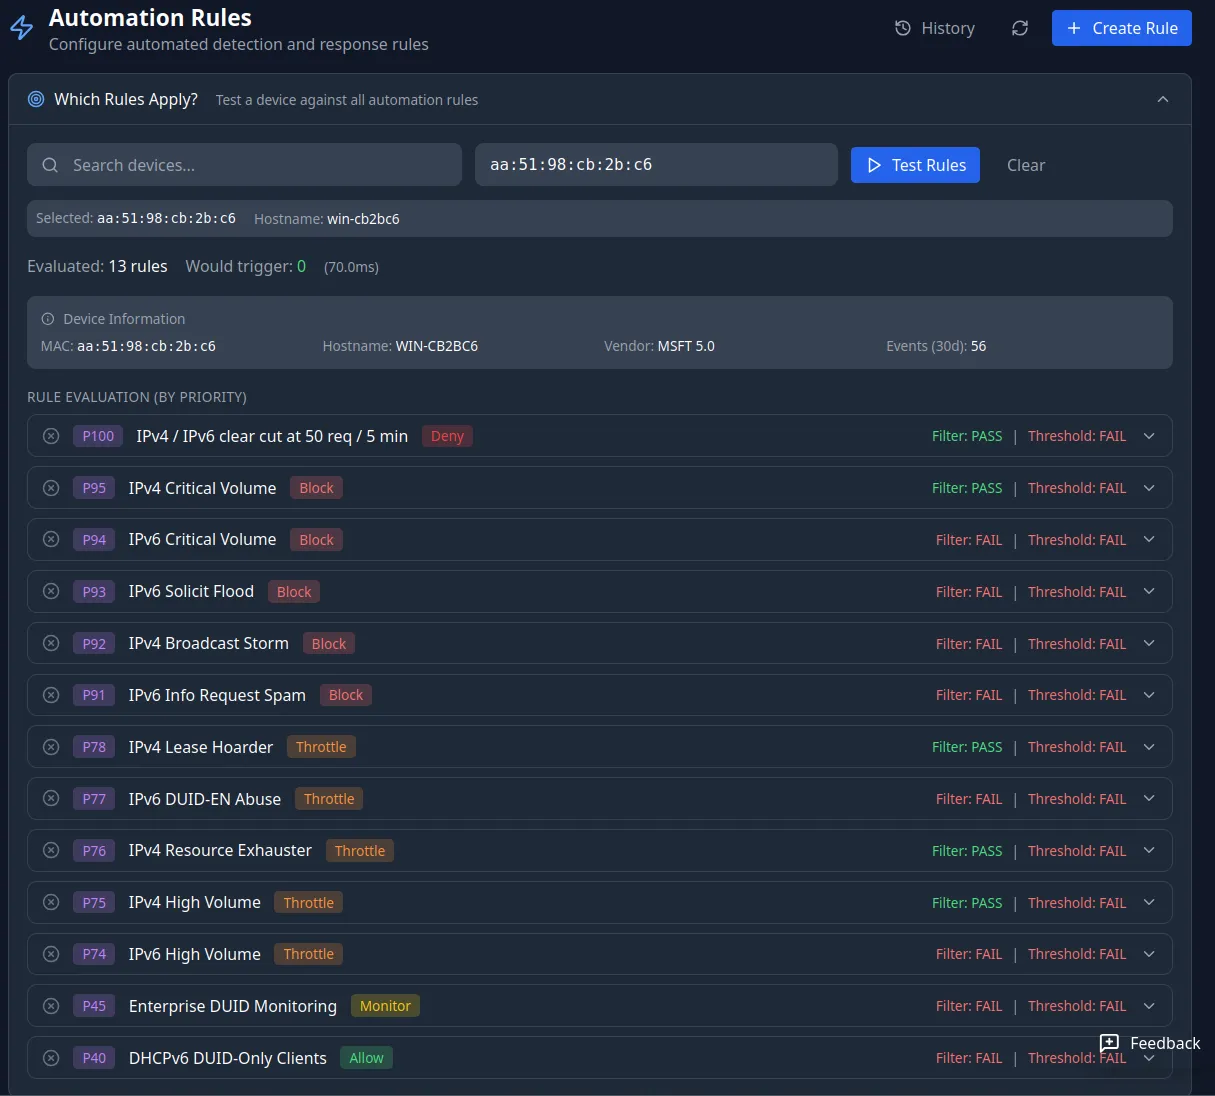
Automation
Automation runs scheduled, query-based rules that find suspicious behaviour and act on it without an operator in the loop. A rule says, in plain terms: every few minutes, look at this traffic table for the last window, find devices that match these filters and exceed these thresholds, and apply this action. Rules carry a priority — when two would fire on the same device in the same cycle, the higher-priority rule wins. Fresh installs ship with around a dozen curated seed rules covering volume tiers and attack patterns, and they belong to you to edit, disable, or extend. A rule can apply enforcement directly, or hand the device to deeper analysis first and act on the verdict.
Scale
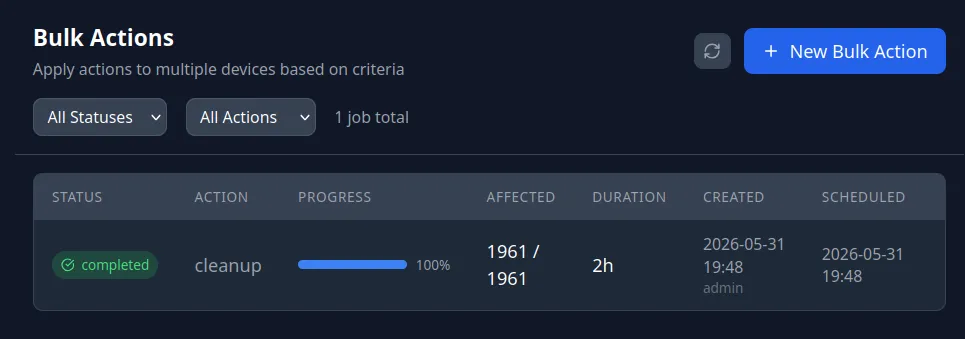
Bulk Actions
When one device at a time is too slow, Bulk Actions applies a single action across many clients in one operation — selected by criteria such as past enforcement, time window, relay, vendor class, or request volume, rather than typed one MAC at a time. A three-step wizard previews the matched set, shows a random sample for spot-checking, then runs in batches. It is DUID- and MAC-aware: DHCPv6 clients that exist only as a DUID are resolved and actioned alongside their IPv4 peers. Jobs can run immediately or be scheduled, and every device actioned is written to the same audit history as a manual action.
Direct control
Firewall Manager
The GUI editor shown above is the Firewall Manager in full. Beyond switching a profile, it stores rulesets as named JSON snapshots and applies them with an explicit choice of how disruptive the swap should be — from a non-disruptive add to a clean table swap. Capture the running configuration as a named snapshot before an experiment, raise a timeout, or roll back to a known-good ruleset in a click. Nothing reaches the kernel until you choose to apply it.
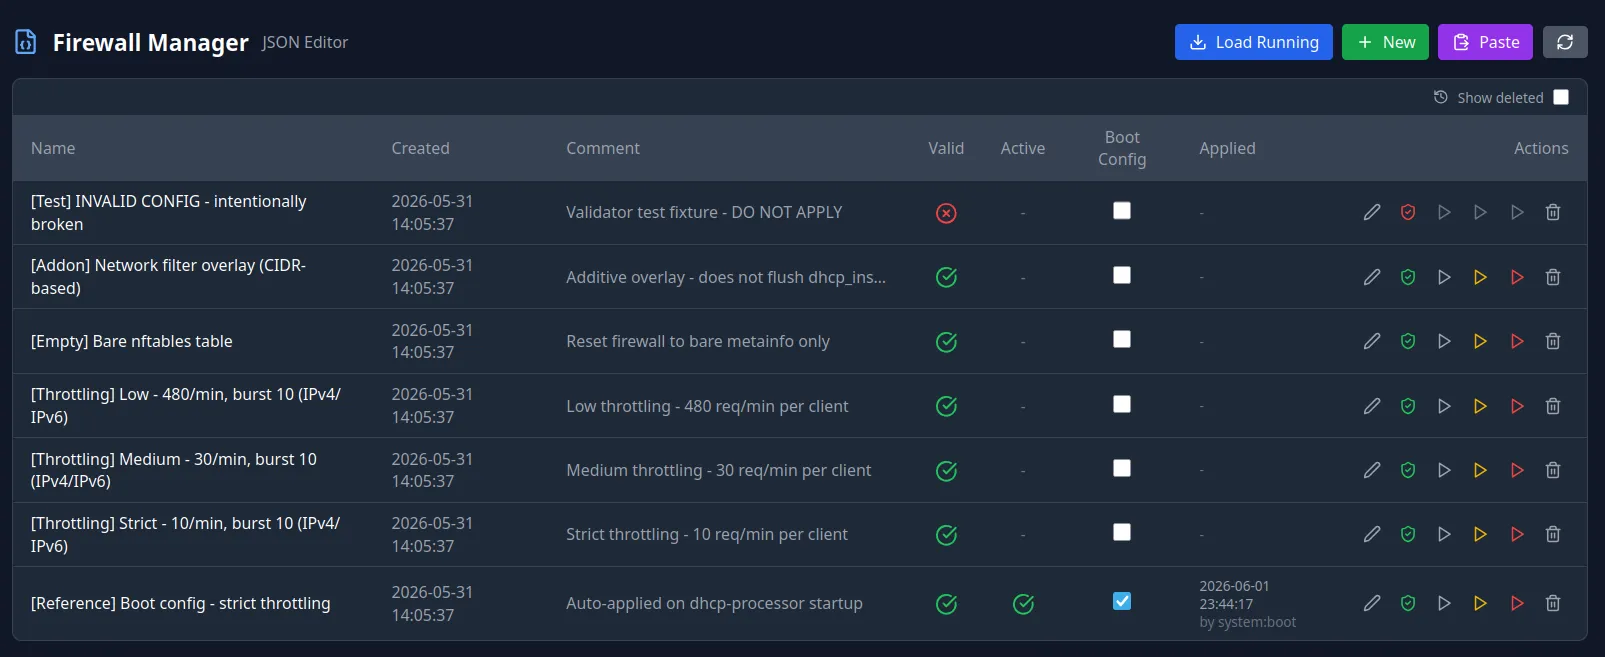
And do notice the "Show deleted" checkbox. Nothing you delete is ever really thrown away — it never hurts to keep one more static config around. User experience first.
Downstream
Notifications
Enforcement events and system alarms do not have to stay on the box. The Notifications layer routes alarms — by channel, severity, and category — to one of two destinations: the in-app bell every operator sees, or an external pipeline via Vector. A single alarm can fan out to both. From Vector you forward onward to the systems you already run — Slack, email, an SIEM, or anything else Vector knows how to talk to — so a 3 a.m. block lands where someone will see it. A circuit breaker pauses external delivery during an outage and resumes once the endpoint recovers.
Keep reading