Overview
What it does
Most DHCP problems are reported as something vague — "a subnet isn't getting leases," "a device keeps getting blocked." Investigation gives you a path from that whole-network symptom down to the single transaction, frame, or decision that explains it, without leaving the appliance.
It is one workflow built from five views. You start broad and narrow down.
DHCP Stream
Watch the network in real time
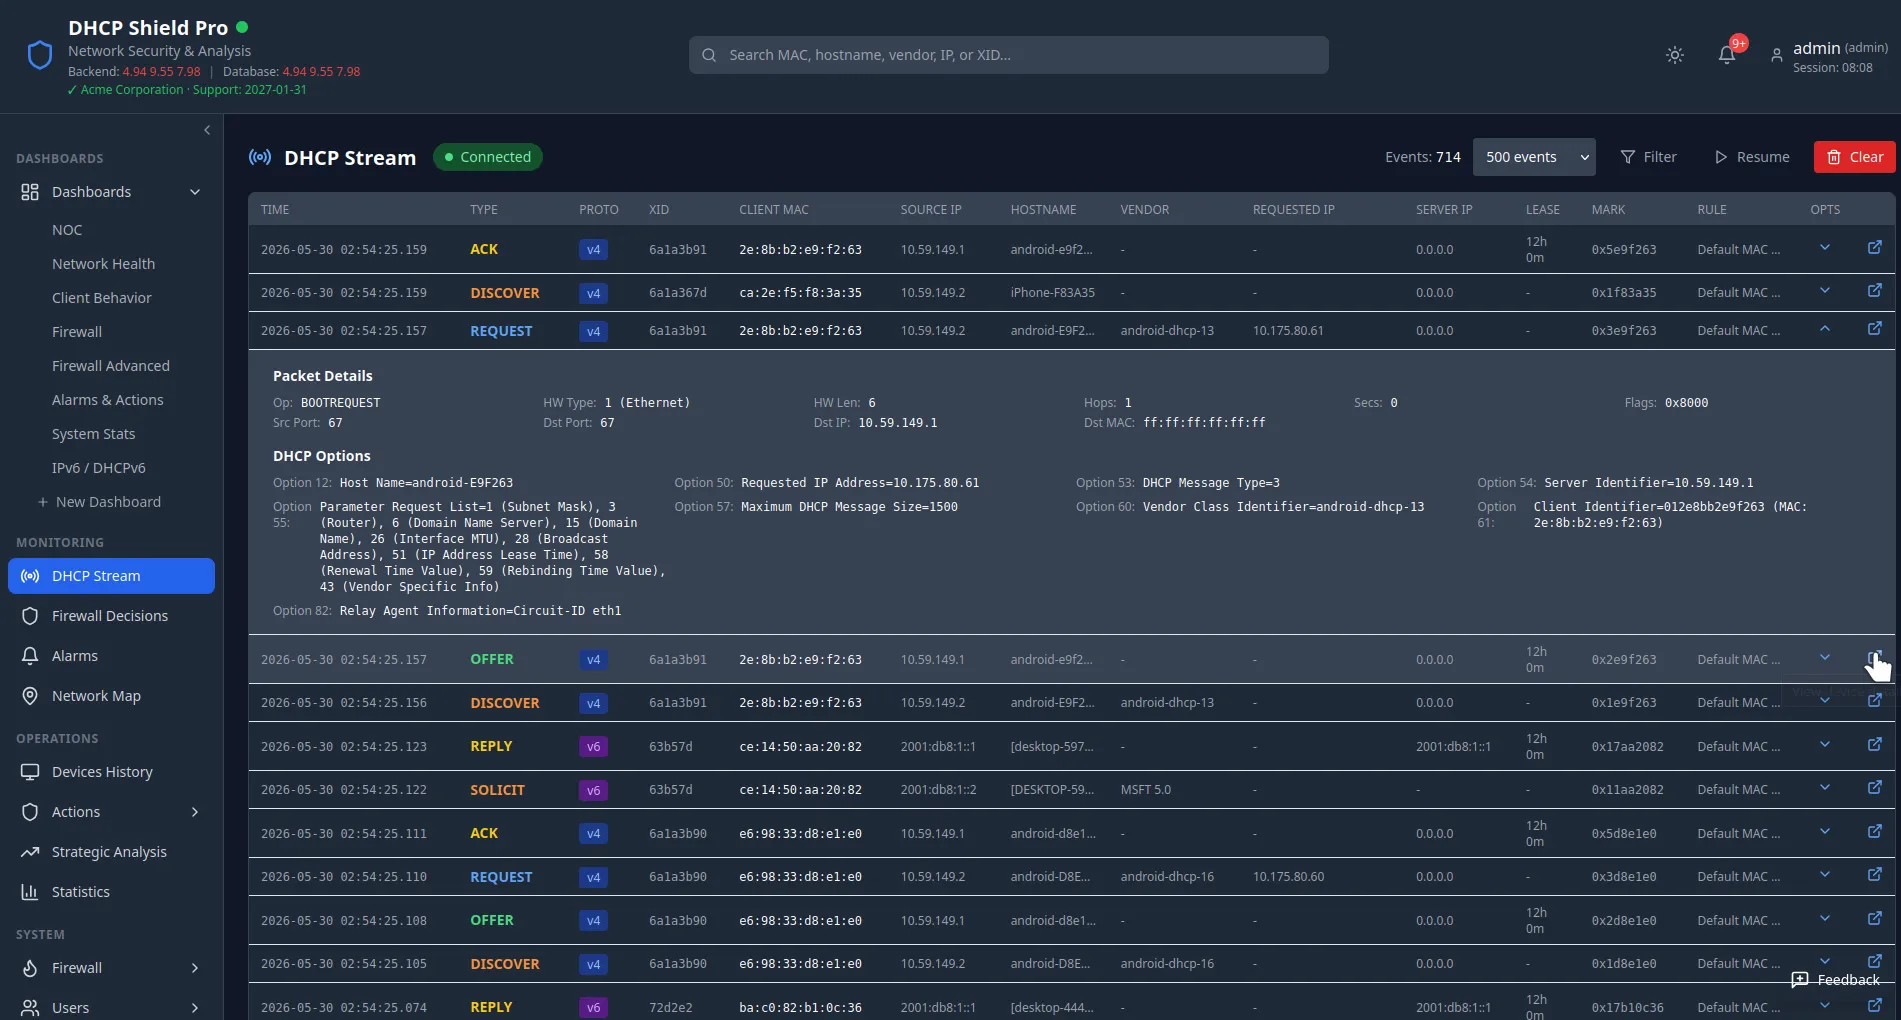
The DHCP Stream is a live WebSocket feed of every transaction the appliance inspects, each as a row in an updating table — message type, DHCPv4/v6 badge, transaction ID, client MAC, hostname, vendor class, requested IP, the assigned mark, and the rule that matched. Click any row to expand the full packet, including every DHCP option and, for DHCPv6, the client and server DUID, IA addresses, delegated prefix, and lifetimes.
Filtering is evaluated server-side, so a busy console never pulls every transaction over the wire. Each filter is a set of rules — a field, an operator, and a value — combined with AND/OR logic and nestable into groups. You can match on roughly thirty fields (client MAC, source IP, hostname, vendor class, message type, relay IP, lease time, any DHCP option by code, and more) with operators that include equals, contains, starts/ends with, regex, numeric comparisons, and in/not-in lists. Filter sets save per user, so a query you build once is one click away next time.
Packet Capture
Capture the raw frames when the stream isn't enough
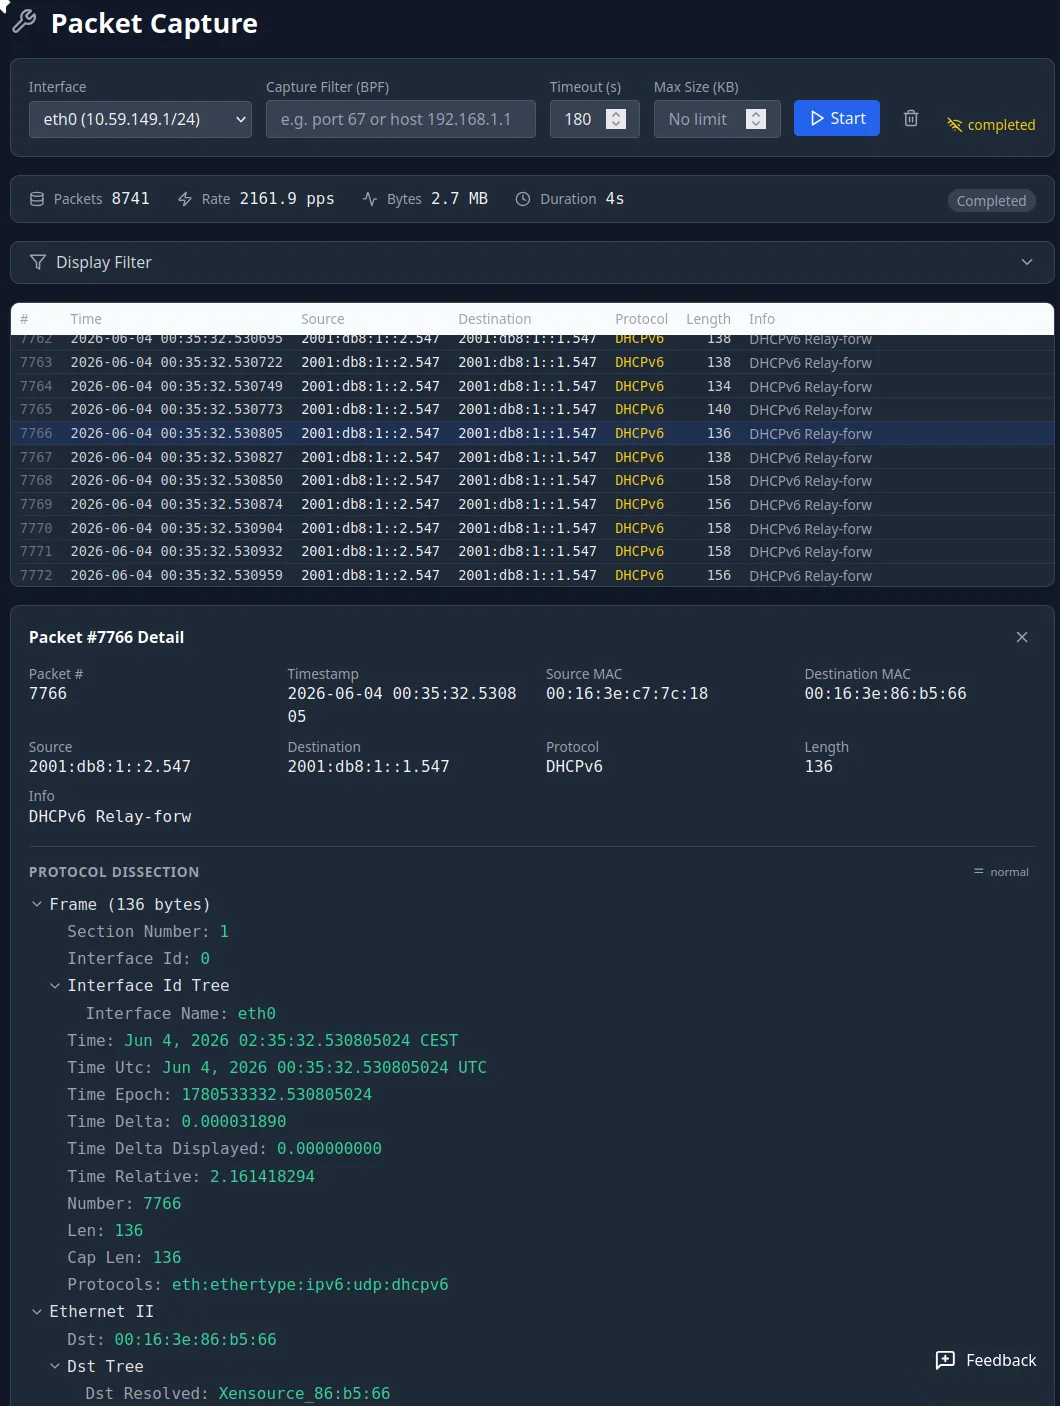
When the parsed view doesn't answer the question, drop to the wire. The
in-browser Packet Capture runs against any interface on the appliance:
pick the interface, write a standard tcpdump-style BPF filter (for
example udp port 67 or udp port 68 for DHCPv4, or
ether host aa:bb:cc:dd:ee:ff for one device), and start.
Matching frames stream into a packet table with a protocol-decoded
detail tree — the same dissection you would see in Wireshark, shown both
as ASCII and hex.
The capture engine runs as its own process, independent of the DHCP processor, so it sees what is genuinely on the wire — useful precisely when you suspect the processor isn't seeing a packet. Every session is saved as a standard libpcap PCAP file you can download and open in Wireshark or tcpdump for offline analysis, or reload into the page later to dissect it again. Timeout and max-size limits keep a capture from filling the disk.
How it narrows
From the whole network to one frame
Drill from the whole network down to one device — and one frame.
- 1
Open the DHCP Stream and watch the live network. A symptom usually shows up as a pattern — a message type that never completes, a vendor class that shouldn't be there.
- 2
Add a server-side filter to isolate the device, subnet, or relay in question, so only the relevant transactions remain on screen.
- 3
Expand a transaction to read its full options. If the parsed view still doesn't explain it, start a Packet Capture with a tight BPF filter and inspect the raw frames.
- 4
Cross-check the Firewall Decisions view to see whether the firewall is acting on the device, and the Alarms list for any condition raised against it.
Firewall Decisions
See what the firewall decided, and why
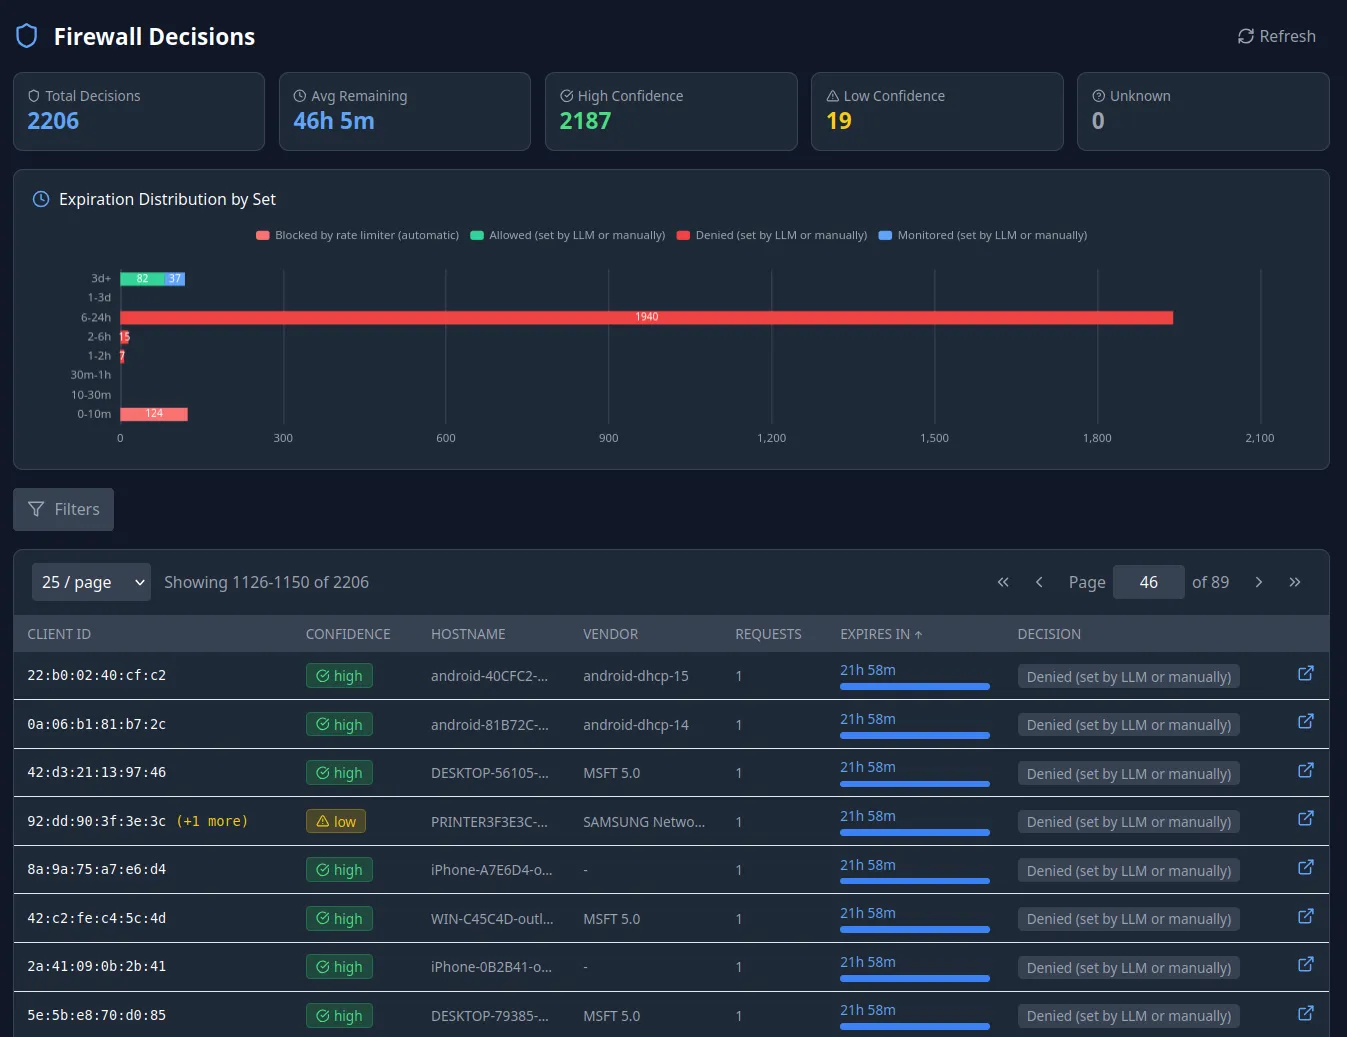
The Firewall Decisions view is a reviewable record of every device the appliance is currently enforcing against — blocked, denied, throttled, allowed, or monitored. Each entry resolves the device's mark back to a MAC address and shows its hostname, vendor class, recent request count, time remaining before the action expires, and a confidence level for the resolution (so you can tell a clean single-device match from a mark collision). When an action came from automated analysis, you can open the full reasoning — risk score, evidence, and explanation.
It answers the common troubleshooting question directly: is this device being blocked, and what put it there? You can act from the same view — remove a device from a set, change its action, or extend the duration — and every change is recorded with the operator's name for a full audit trail.
Alarms
Triage what the system flagged
Alarms surface conditions worth a human's attention — both system health (such as database or disk issues) and enforcement events raised against a specific device, like a block, deny, or throttle. Device-specific alarms carry the MAC address or DUID, the measured value, and the threshold that was crossed, so triage starts with the device already identified.
Each alarm has a clear lifecycle — firing, acknowledged, resolved — with colour-coded severity (critical, warning, ok, unknown) and a full history of every state change and who made it. You can acknowledge an alarm (optionally for a set duration) while you work the issue, resolve it when the cause is addressed, and handle several at once in bulk.
Terminal
Hands-on troubleshooting on the appliance
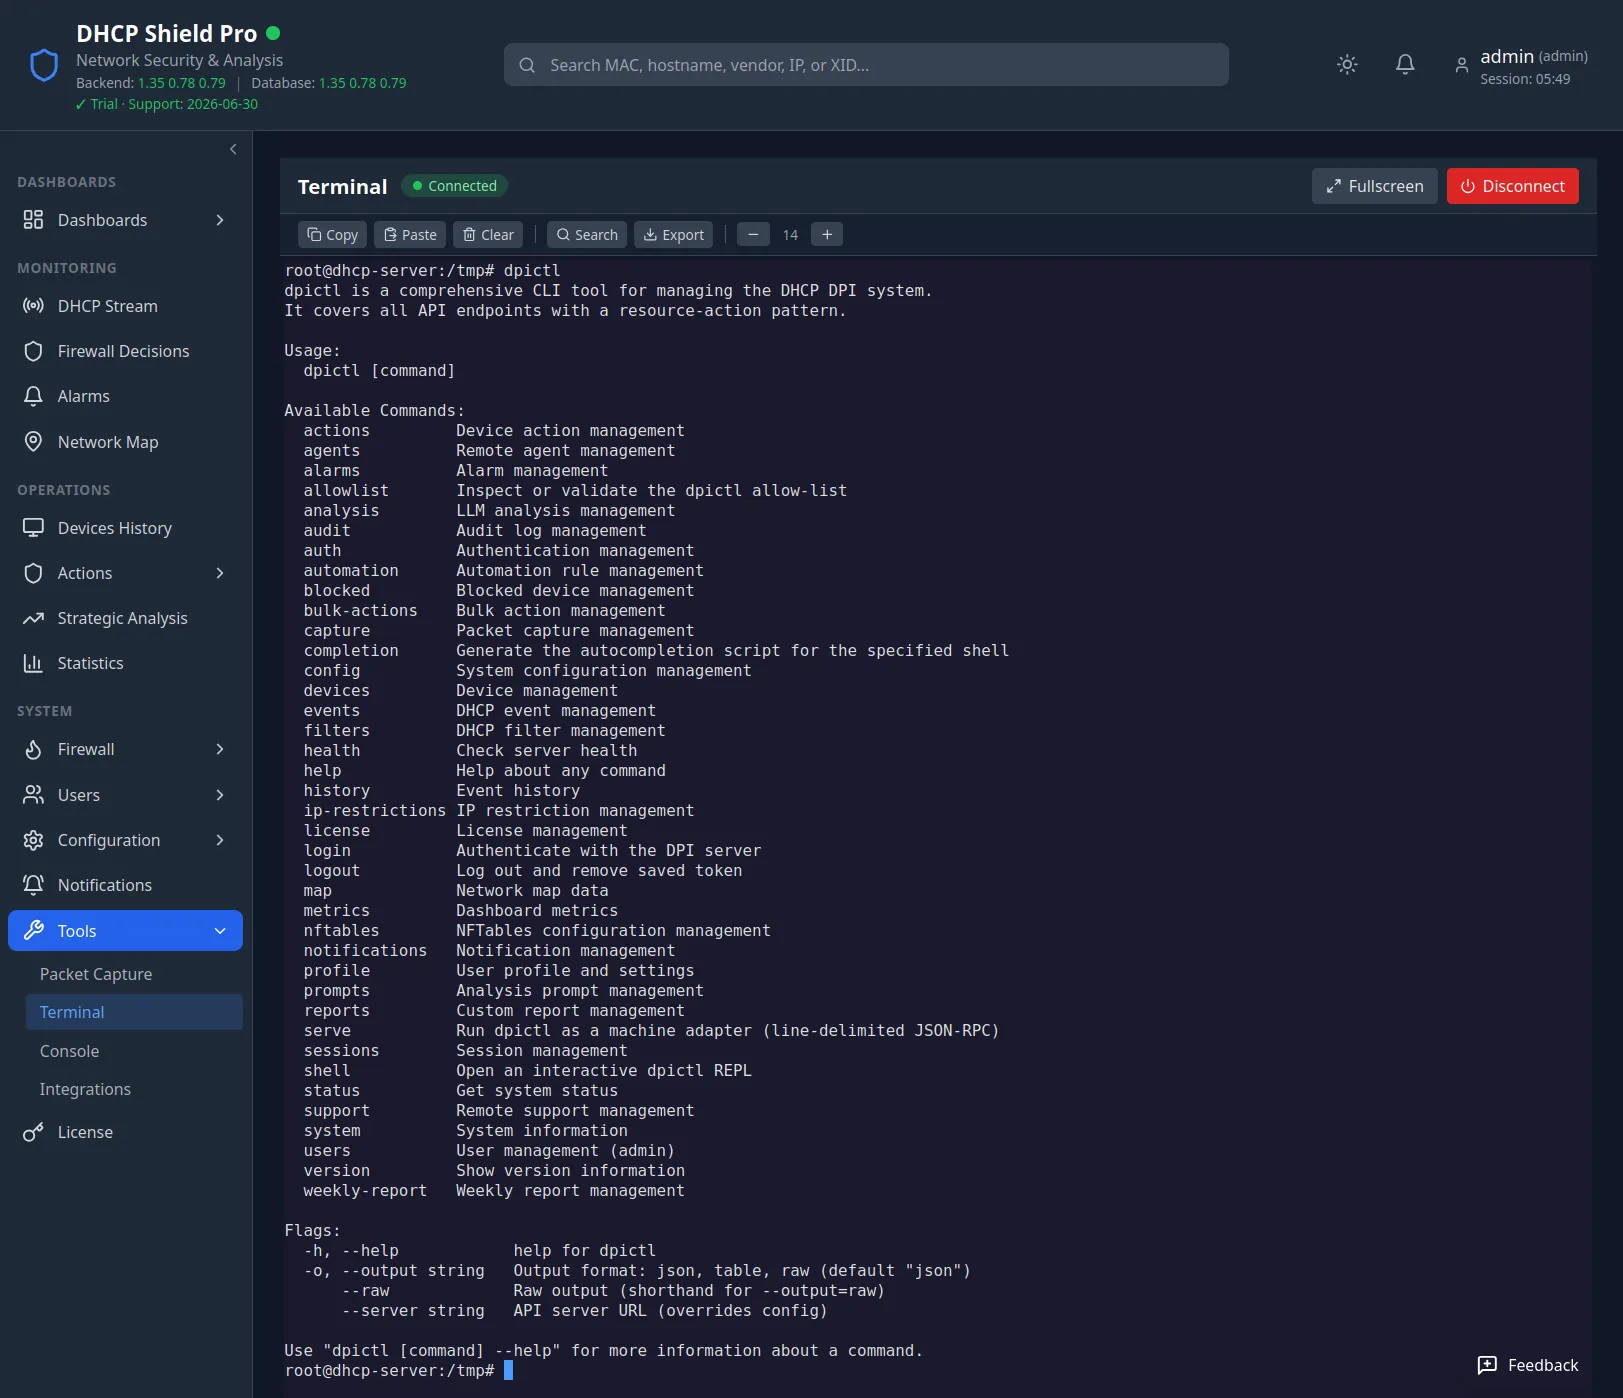
For the situations the GUI doesn't cover, the appliance includes a web Terminal: a real bash shell on the appliance itself, opened in a browser tab, admin-only, with every session start and end audit-logged. It is the escape hatch for tailing the processor log, checking service status, running an ad-hoc query against the local database, or confirming interface state during an investigation.
It is a genuine terminal — command history, tab completion, and full-screen TUI applications all work, with a scrollback buffer you can search and export. This is the local appliance terminal for your own engineers; it is not a vendor remote-support channel. When the GUI gives you the answer, use the GUI; the Terminal is there for the times it can't.
And here's the terminal — if that's your thing. It can be disabled entirely from the API, too, in case your security officer just had a heart attack.
Keep reading